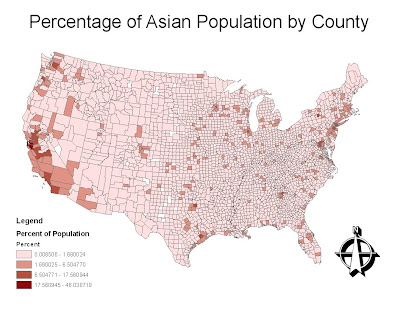
Map 1: The concentration of Asians by county.
In this map, we analyze the distribution of the Asian population across the lower 48 states. It becomes clear that most Asians reside primarily in counties that border the Pacific Ocean. This can most likely be attributed to Asia's relatively close proximity to America's west coast. We also observe that Asians are highly concentrated in urban areas, such as Orange County, Los Angeles County, Santa Clara County, San Francisco County, and Seattle. The Asian community has made tremendous inroads within the technology industry, especially within Santa Clara County's Silicon Valley. Also, we notice concentrations of Asians across the Midwest as well as the Eastern seaboard. This could be due to family roots, friends, and jobs.

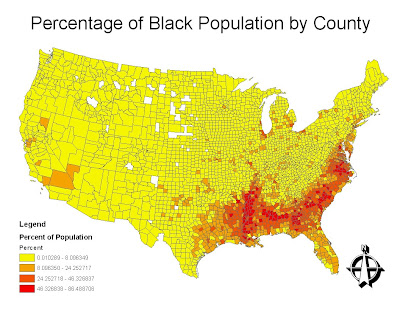
Map 2: The concentration of blacks by county.
This map analyzes the concentartion of the black popualtion across the lower 48 states by county. The concentartion is strikingly clear. Most of the black population is concentrated in the South, especially in Louisiana, Mississippi, Georgia, and South Carolina. Historically, this can be attributed to their original settlement in the deep south resulting from slavery. In addition, in other regions of America, the black population is concentrated around urban centers, such as Detroit, Michigan and Los Angeles, California.

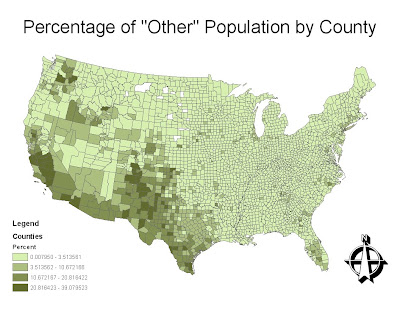
Map 3: The concentration of "other" by county.
This map displays the concentration of "some other race" across the lower 48 states by county. It can be deduced that this category primarily refers to the Hispanic population. The counties with the highest concentrations are along the Mexico-United States border, throughout the Southwest. There is also a significant concentration in the counties surrounding Miami, Florida, which is close to the Latin country Puerto Rico. Agricultural counties, such as California's central valley also contain a significant number of Hispanics.
Concluding Discussion
After mapping and analyzing the census data of these three races, it is possible to reach several conclusions. First of all, each race tends to clump into certain regions of the country. For instance, Asians settle along the Pacific coast, blacks reside in the deep south, and the "other" race lives throughout the Southwest. Each race appears to settle within the urban centers of their chosen regions. However, a second striking observation is that each race is represented in almost every county. With minimal exceptions, every county across the country has an Asian, black, and "other" presence. While these populations may be small in most counties, they are significant. These three maps demonstrate the very racial tendencies that make America a melting pot.
Overall Impressions of GIS
Over the course of this quarter, I have come to realize the extensive potential of GIS. GIS technology provides a unique geographical tool that assists the general public in their understanding of the world. GIS software can transform data into visual and dynamic models that can help to solve some of the world's greatest problems. GIS can manipulate census data to help predict political outcomes. GIS can manipulate forest fire data to aid in fire investigations and prevent future wildfires. Overall, I cannot wait to further understand and learn the tools of GIS, as it will undoubtly become a growing feild in the near future.
No comments:
Post a Comment